Letting Data Speak, AI Act!
Case Study
Data ScienceClinical Application for Tracking and Managing Autoimmune Diseases
Overview
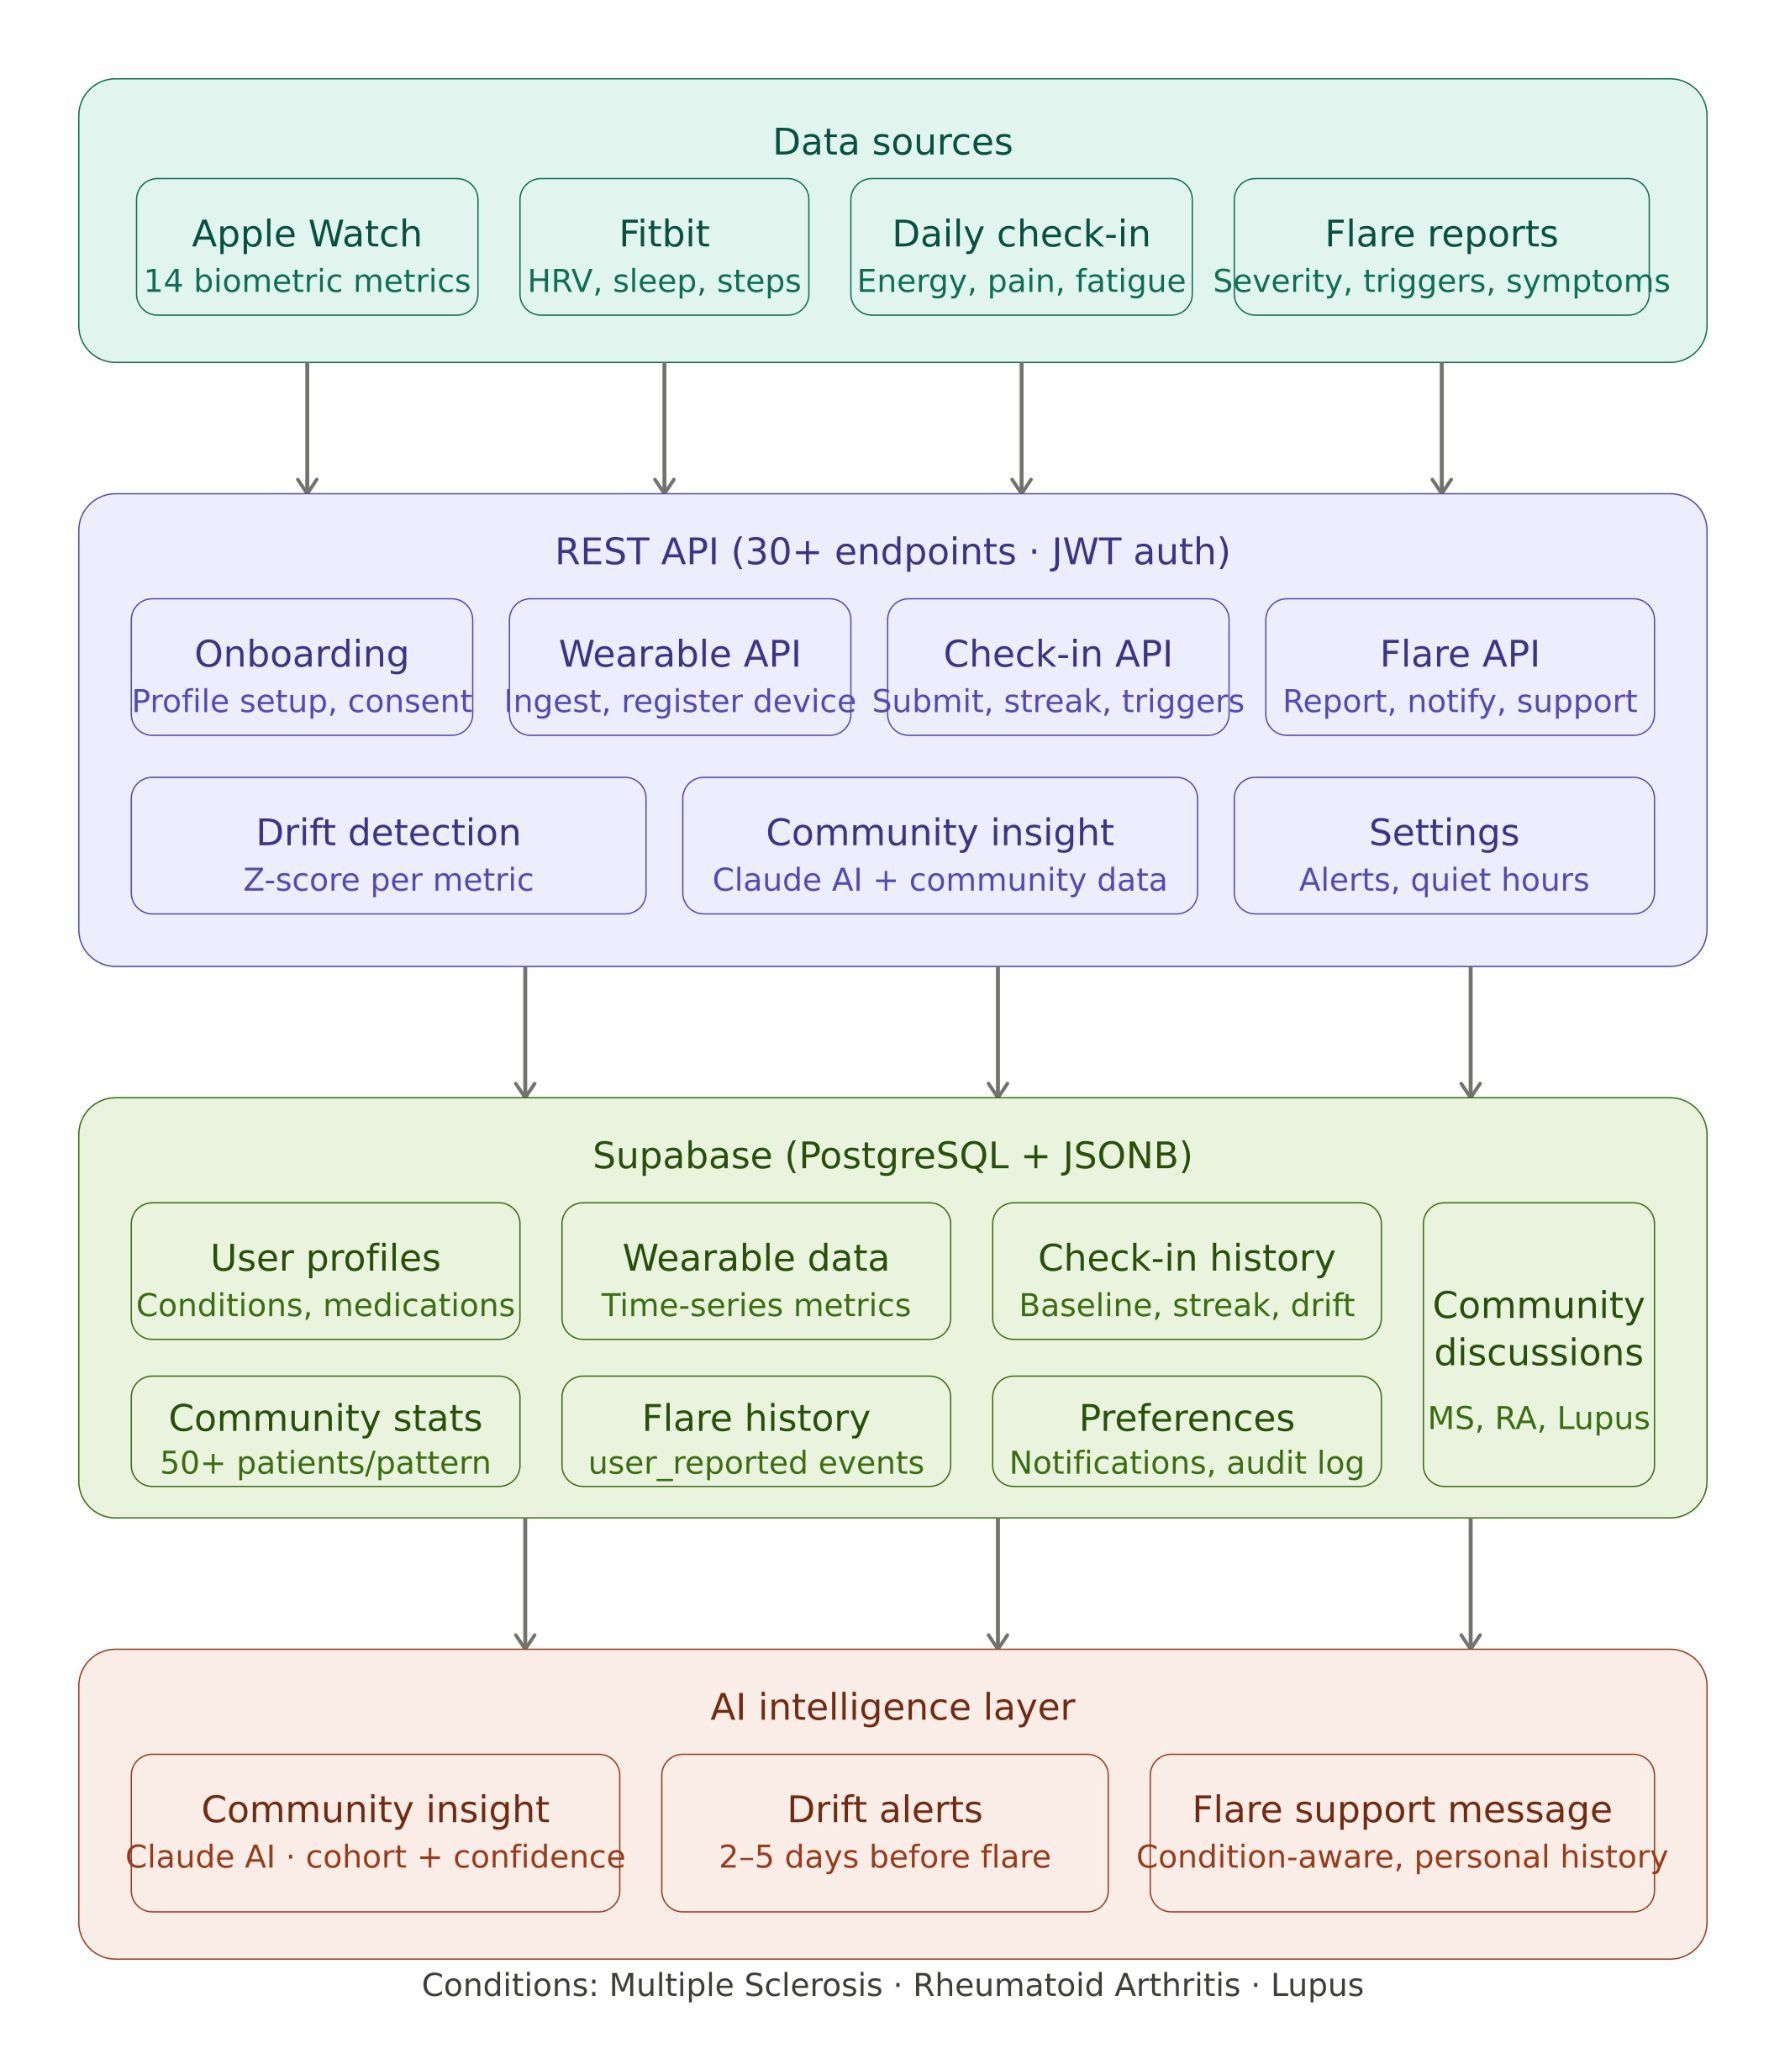
A digital health startup is building the intelligence layer for patients living with MS, RA, and Lupus — an alpha-stage platform focused on the data collection phase. It integrates Apple Watch and Fitbit biometrics with structured daily check-ins and flare reports, all stored in database, and enriches onboarding with Claude AI–powered community insights derived from real patient. The system delivers a production-ready REST API with 30+ endpoints covering onboarding, daily tracking, flare reporting, wearable ingestion, drift detection, home dashboard, and account management. It also includes personalized z-score–based anomaly detection, statistically rigorous community intelligence built from 50+ patient cohorts, and foundational infrastructure for proactive flare prediction in future releases.
About the Client
A digital health startup founded by a product leader with deep operational experience at Shopify where she generated $850M in revenue, led teams of 700+, and helped sell a $2B business unit. She personally manages a chronic condition and has tracked daily with wearables for 8 years, making her both the builder and the customer.
The company is building the missing intelligence layer for patients living with Multiple Sclerosis, Rheumatoid Arthritis, and Lupus aggregating signals from wearables, daily check-ins, and labs to detect health drift before flares occur and deliver personalized actions that help patients stabilize before symptoms escalate.
The Challenge
Patients managing MS, RA, and Lupus were generating hundreds of data points daily through wearables — sleep, HRV, heart rate, activity yet still had no way to answer: "Did yesterday's decisions actually help? What should I change today?" The intelligence layer was missing.
Every other domain where data drives outcomes already had this layer. Finance had Mint. Logistics had Route. E-commerce had Shopify. But chronic care patients were left manually correlating fragmented data, experimenting through trial and error, and learning after flares happened instead of catching them early.
Three structural thresholds had just crossed simultaneously:
- Wearables reached ubiquity among people managing chronic illness — Apple Watch and Fitbit were mainstream.
- AI could now reason across individual, longitudinal time-series data rather than population averages.
- Chronic conditions had outpaced clinical capacity — 60% of Americans had at least one chronic condition, while the average doctor visit lasted under 20 minutes.
Generic wellness tools failed this population entirely — offering population-level advice irrelevant to MS, RA, and Lupus patients, tracking data reactively after flares rather than detecting drift beforehand, and surfacing insights without actions.
Key Results
- Eliminated fragmented health tracking by integrating wearable and manual inputs into a unified pipeline, enabling consistent capture of 14+ biometric and behavioral metrics per user per day
- Improved data reliability and continuity with automated device registration and reconnection logic, ensuring seamless ingestion even during intermittent sync failures
- Built a large-scale disease intelligence base by analyzing 10,000+ patient discussions across Multiple Sclerosis, Rheumatoid Arthritis, and Lupus cohorts
- Enabled personalized patient insights from day one by combining AI with community data, delivering context-aware recommendations during onboarding
- Accelerated patient understanding of disease patterns through quantified insights (e.g., prevalence trends with confidence scores), reducing reliance on trial-and-error decision making
- Delivered a scalable backend foundation with 30+ production-ready APIs, supporting full lifecycle workflows from onboarding to long-term health monitoring
Our Solution
This is the alpha version of Theme Health, focused on the data collection phase. The core of this release establishes the foundational infrastructure for capturing, storing, and beginning to make sense of patient health data across MS, RA, and Lupus.
1. Onboarding & Health Profile Setup The onboarding flow captures a patient complete health baseline without requiring clinical credentials. The API covers diagnosis timeline, primary and secondary condition selection, medication mapping with real side-effect statistics drawn from existing user data, symptom baselines, flare frequency history, demographics, and wearable device preferences. Race conditions on account creation are handled gracefully, profile completion scores are initialized (35–40% at baseline), and default user preferences are seeded — ensuring a clean, fully initialized profile on first login.
At the end of onboarding, the /community_insight endpoint fires — querying community posts and extracted entities for the user's condition and medications, passing the data to Claude AI, and returning a personalized community insight with cohort size and confidence level (e.g., "Many people with MS on Methotrexate report that fatigue peaks in the first few weeks. Most find it stabilizes after 2–3 months."). This gives every new patient immediate, relevant context before they've logged a single check-in.
2. Daily Check-In — The Core Data Collection Engine The daily check-in is the heartbeat of the data collection phase. Each submission via POST /v1/checkin/daily captures:
- Energy level, and severity scores for Pain, Stress, Fatigue, and Brain Fog
- Comparison to baseline ("about the same", "worse", "better")
- Triggers — both from a condition-scoped master list and free-text custom triggers created by the user
- Medication adherence status
- Additional symptoms beyond the four static ones, including custom symptom names
- Time-of-day context (morning, afternoon, evening) derived from the client-side timestamp in the user's local timezone
Every submission returns a motivational message, the user's current consecutive day streak, and asynchronously fires a background insight generation job — so AI processing never blocks the response. A companion Boost Accuracy flow (GET/POST /v1/checkin/boost-accuracy) incrementally captures activity level, age range, region, and work status, pushing profile completion toward 100% over time.
3. Flare Reporting The POST /v1/flare/report endpoint captures disease exacerbation events with structured severity scoring (mild = 3, moderate = 6, severe = 9), relative start date resolution, full symptom and trigger logging, and a supportive message generated from the patient's personal flare history. If notifications are enabled in Supabase user preferences, a follow-up check-in is automatically scheduled 4 hours post-report. Flares are tagged as user_reported in the flare_history table — laying the groundwork to distinguish self-reported events from algorithm-detected drift events in future releases.
4. Apple Watch & Fitbit Data Ingestion The POST /v1/wearable/data endpoint accepts 14 biometric metrics per submission from Apple Watch and Fitbit — HRV, resting heart rate, sleep duration and efficiency, deep/REM/light/awake sleep stages, steps, active calories, SpO2, respiratory rate, and exercise type. All data is persisted in Supabase across wearable_device_master and wearable_data_points tables. Device management is fully automated: new devices register on first submission, previously disconnected devices reactivate without data loss, and users can toggle connection status via PUT /v1/wearable/connection or retrieve their full device history via GET /v1/wearable/devices.
5. Personalized Community Insights at Onboarding The /community_insight endpoint is the alpha's first AI-powered feature. It accepts the user's condition and medication list as query parameters, queries the extracted_entities tables for community-sourced discussions relevant to that profile, and passes the data to Claude AI to generate a personalized insight. The response includes the insight text, cohort size, and a confidence level (low / medium / high). This is the first moment a patient sees that the platform knows something specific about people like them — before they've contributed any data of their own.
6. Drift Detection — Laying the Early Warning Foundation The GET /v1/drift_detection endpoint runs z-score analysis against each user's personal Supabase-stored baseline. For each metric — energy, stress, fatigue, pain, brain fog — it computes the user's personal mean and standard deviation across all historical check-ins, then calculates the z-score for the most recent day. Energy is flagged at z < -2.0 (significant decline); all other metrics are flagged at z > +2.0 (significant spike). Human-readable descriptions are returned for every flagged metric. In this alpha phase, this endpoint establishes the statistical foundation for the proactive flare prediction layer planned for the next release.
Technologies Used
Related Case Studies
← Back to All Case Studies
Data Science
AI-Assistance for Customer Support for Rent-to-Own Industry
A rent-to-own industry organization struggled with inconsistent customer support quality and slow response times that impacted lead conversion rates. By implementing an AI-powered chat assistance system using AWS Bedrock and retrieval-augmented generation, the organization enabled agents to receive three context-aware response suggestions within seconds during live conversations. The solution leverages historical successful conversations through semantic search and Claude Haiku 4.5, ensuring every agent delivers high-quality, proven communication strategies regardless of experience level. The serverless architecture processes thousands of requests monthly while maintaining reliability through intelligent fallback mechanisms and comprehensive monitoring.
Read More
Data Science
Artificial Intelligence - Driven Candidate Screening Revolution
JashDS revolutionized a company's hiring process by developing a GenAI-powered candidate screener that reduced time-to-hire by 50% and improved hiring outcomes. The solution leverages advanced language models to conduct dynamic, role-specific interviews, automatically generating and adapting questions based on job descriptions and candidate responses.
Read More
Data Science
Artificial Intelligence Model for Retail Shelf Monitoring
JashDS revolutionized retail shelf management for a major grocery chain by developing an AI-powered real-time monitoring system. The solution utilized advanced computer vision techniques and deep learning models to detect out-of-stock and misplaced products, significantly improving inventory accuracy and enhancing the customer shopping experience while reducing manual labor costs.
Read MoreHave a similar challenge?
Connect with us